


2017 Black Friday & Cyber Monday Stats for the Small Online Merchant
It’s time again for our Black Friday & Cyber Monday stats report for small online stores. We’ll start by listing the stats for large merchants that have come out so far:
Big Merchants – Ecommerce Sales
Adobe Digital Index has their numbers out for this year*:
- Thanksgiving sales up 18.3% over 2016
- Black Friday sales up 16.9% over 2016
- Cyber Monday sales up 16.8% over 2016
- Thanksgiving thru Cyber Monday sales was not listed this year
*Normally Adobe lists their numbers like they did in their 2016 report, but this time they wrote a different article summarizing them and only posting a few numbers. We were able to use this link for this year, by checking the “Revenue: By Key Date” numbers in the “Revenue” section.
comScore numbers for this year are:
- Thanksgiving sales up 22%
- Black Friday sales up 20%
- Cyber Monday sales up 26%
- Thanksgiving thru Cyber Monday sales up 21%
Adobe uses data from 5,000 companies worldwide that use the Adobe Digital Marketing Cloud for their report.
comScore doesn’t show the number of stores sourced for their data, but they mention 3,200 clients in their report.
Small Merchants – Same Stores Compared
If you’ve been following our holiday posts for the last few years, you know that one thing we do differently than most holiday stats reports is that we compare the same exact stores for both years to get true comparison results. Citing an increase in sales when your data pool has changed will obviously include changes due to the different stores or just by having a larger/smaller data pool from year to year.
In our stats we’ve used data from 148 small online stores (typically less than 10 employees) to compare the Thanksgiving holiday sales between 2016 and 2017:
- Thanksgiving sales up 2.22% over 2016
- Black Friday sales up 24.72% over 2016
- Cyber Monday sales up 6.01% over 2016
Some additional numbers, for the Thanksgiving Holiday weekend of Thursday thru Cyber Monday:
- Average order value up 0.97%
- Total number of orders up 10.16%
- Revenue up 11.35%
Charting The Results
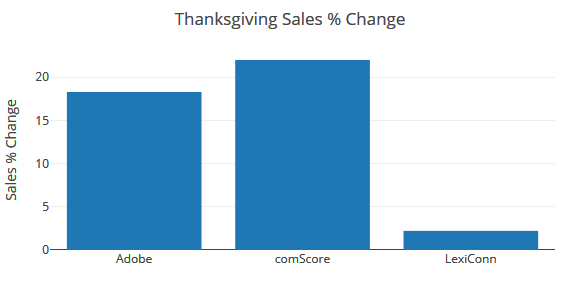 Just like we see in prior years, the small stores had only a tiny increase on Thanksgiving when compared to large stores.
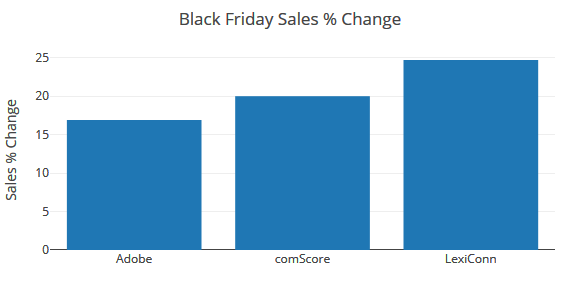 Last year our small stores had a 3.05% drop in sales on Black Friday, but now they are back and even have a greater increase then the large stores, with an improvement of 24.72% over their 2016 sales.
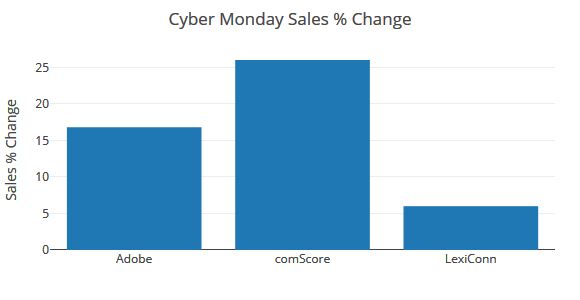 Similar to prior years, our small stores only saw a small increase on their Cyber Monday sales with a 6.01% increase. That’s much better though then their 1% increase last year.
Even though it was a small increase over 2016, Cyber Monday was again the largest shopping day of the 5 days for the small merchants. This graph shows the percentage of sales on each day for Thursday thru Cyber Monday:
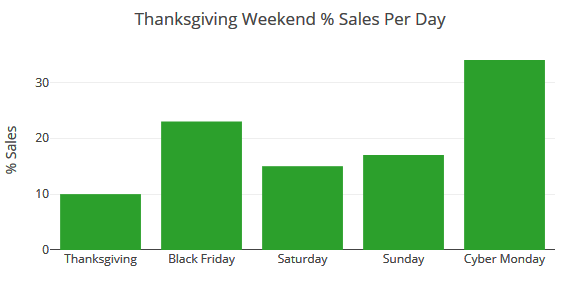 Cyber Monday had the highest with 34% of the sales (down 2 points from 2016), followed by Black Friday at 23% (up 2 points from 2016). The remaining 3 days all fell in the 10-17% range.
Conclusions
We always see that the small merchant’s stat vary against the large ones, just like they did in prior years (2016, 2015, 2014, 2013, 2012), but they continue to increase their sales, even with much large competitors looming only clicks away on the internet. This year they increased their total revenue by 11.35% for the 5 day weekend, a great improvement for the small merchant.
…
Graphs generated at https://plot.ly
Looking for a web host that understands ecommerce and business hosting?
Check us out today!