


How to use a PHP profiler to audit a slow Adobe Commerce site
Introduction
Time to first byte (TTFB) is how long it takes a server to generate HTML of a requested page. 1-2 seconds is an acceptable TTFB of an uncached page. Anything above it could be a sign of a performance issue.
In this guide I’ll show you how to use a PHP profiler to improve TTFB of an Adobe Commerce site (or any other PHP based site). As a Magento 2 developer I used this technique to optimize numerous slow pages and it helped a lot.
What is Tideways and how to use it
Tideways is a commerce version of an abandoned XHProf PHP profiler. Once it’s set up it gives you a trace diagram with function call names and respected times it took to execute them.
Tideways has a free trial period, you don’t need to provide credit card details to sign up. All you need is an email address. It gives you 14 days of trial use but the trial period length might change in the future, check with their website.
Once you registered for a trial, you’d need to install a php extension and a daemon. There are instructions on tideways website but you might need expert help.
Run a manual trace
Turn off Magento 2 full page cache and find a page that you think is too slow. Head over to Traces > Trigger trace and click on Generate Token:
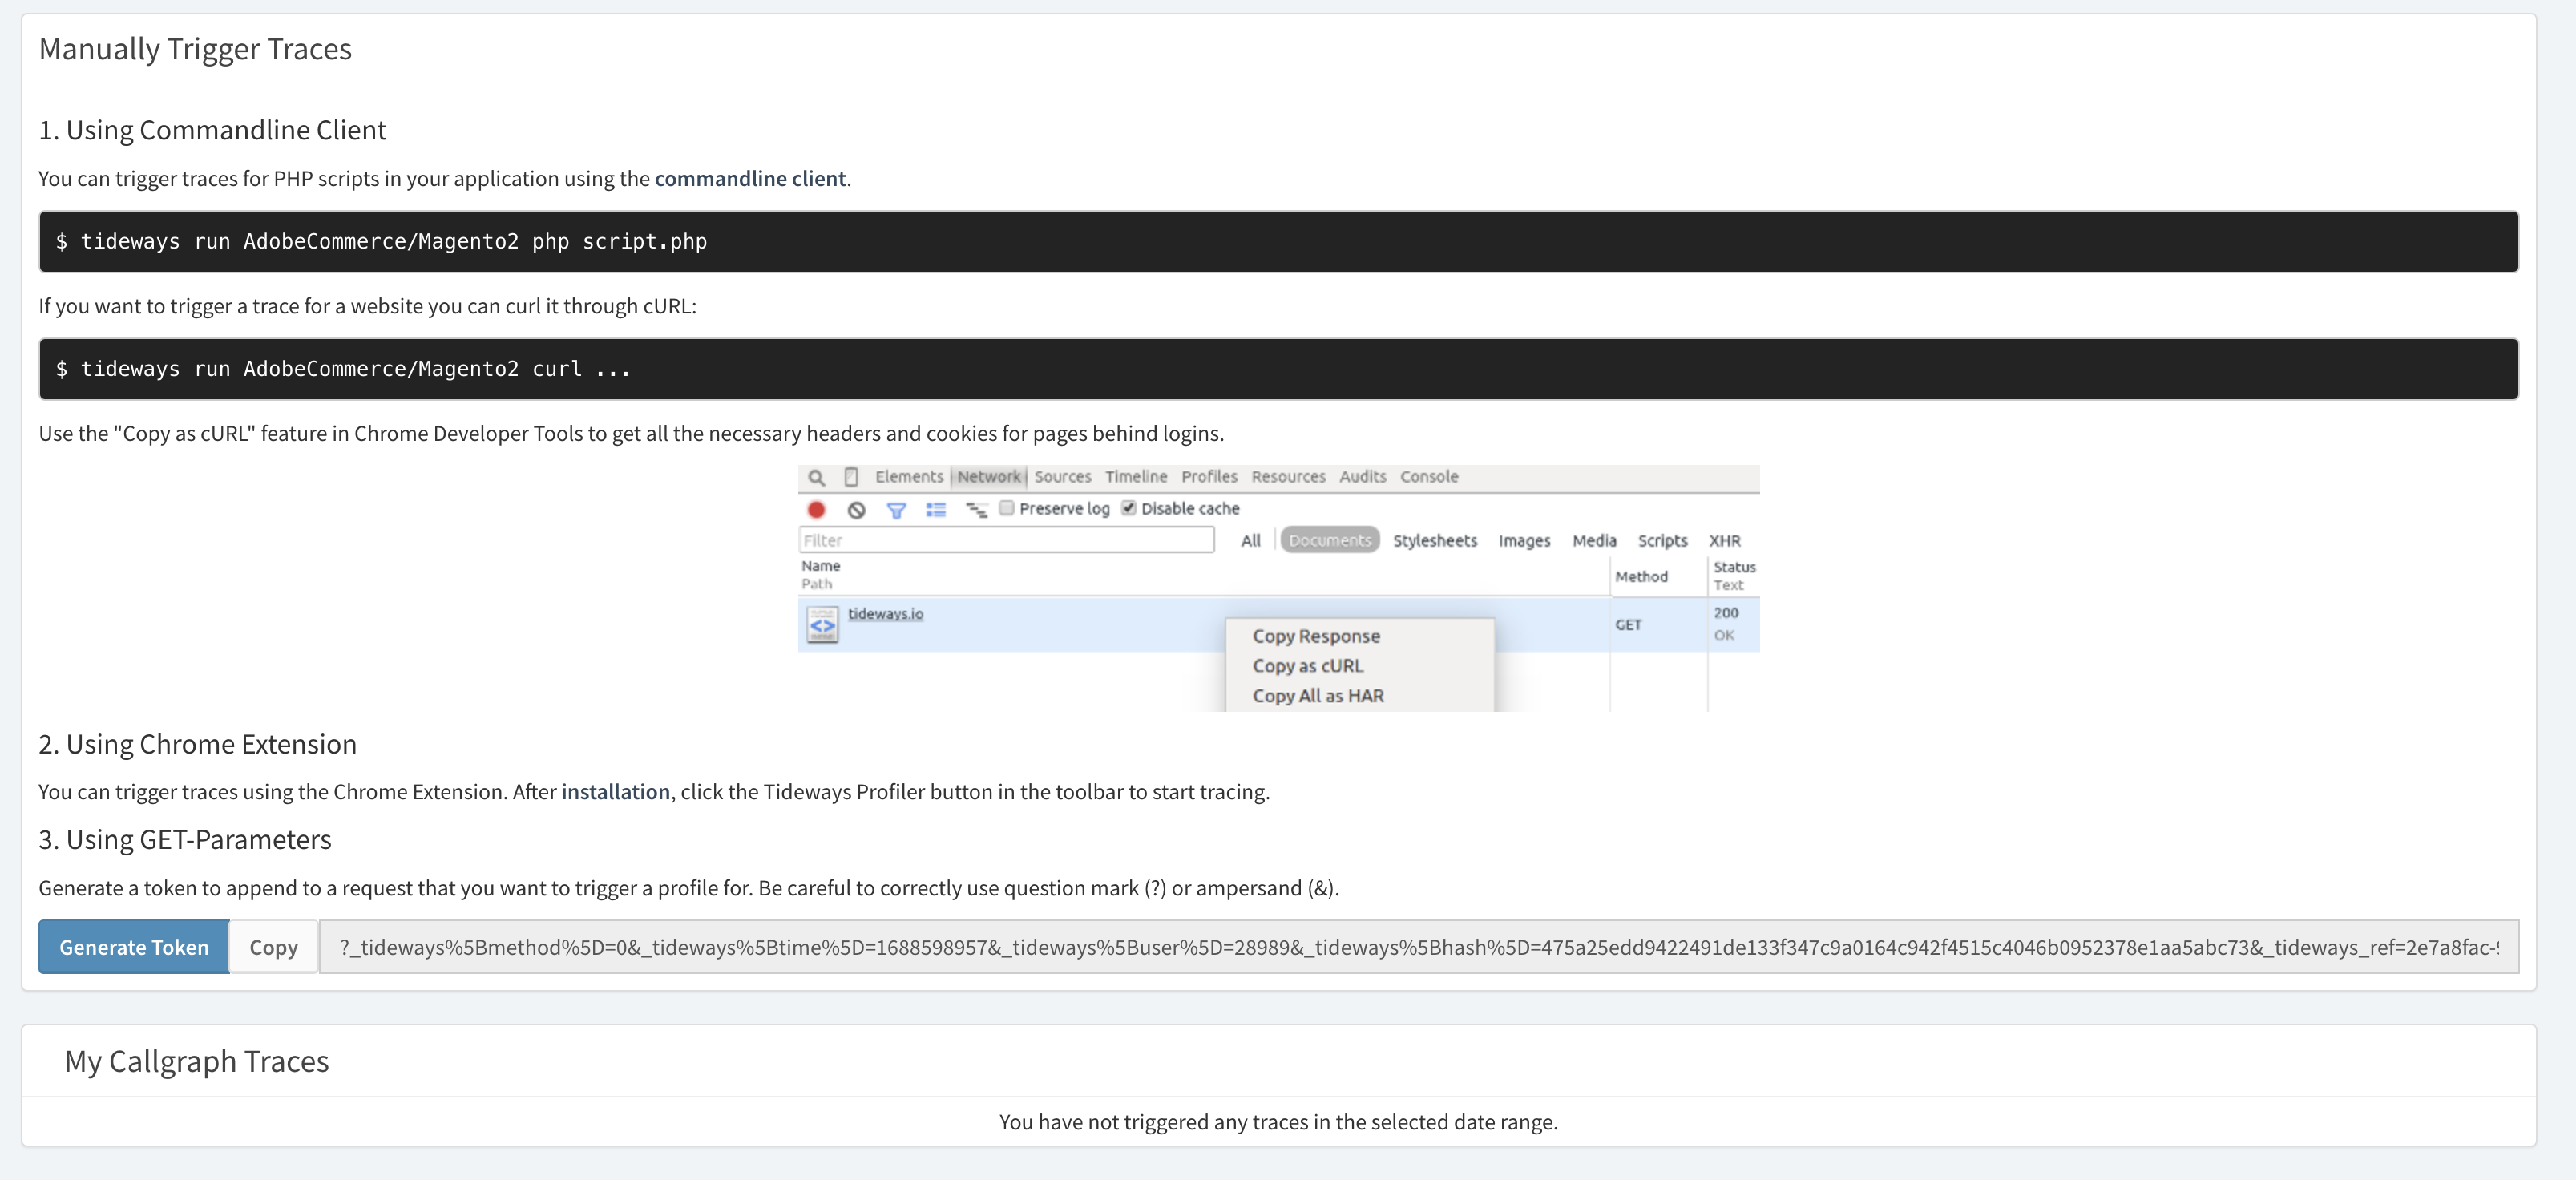
(click to enlarge)
Copy the token, append it to the page URL and fetch it with a browser. Wait 2-3 seconds and your trace is going to be available for analyzing.
Analyze trace output
Diagram has several tabs: Timeline, Summary, Callgraph and Bottlenecks:
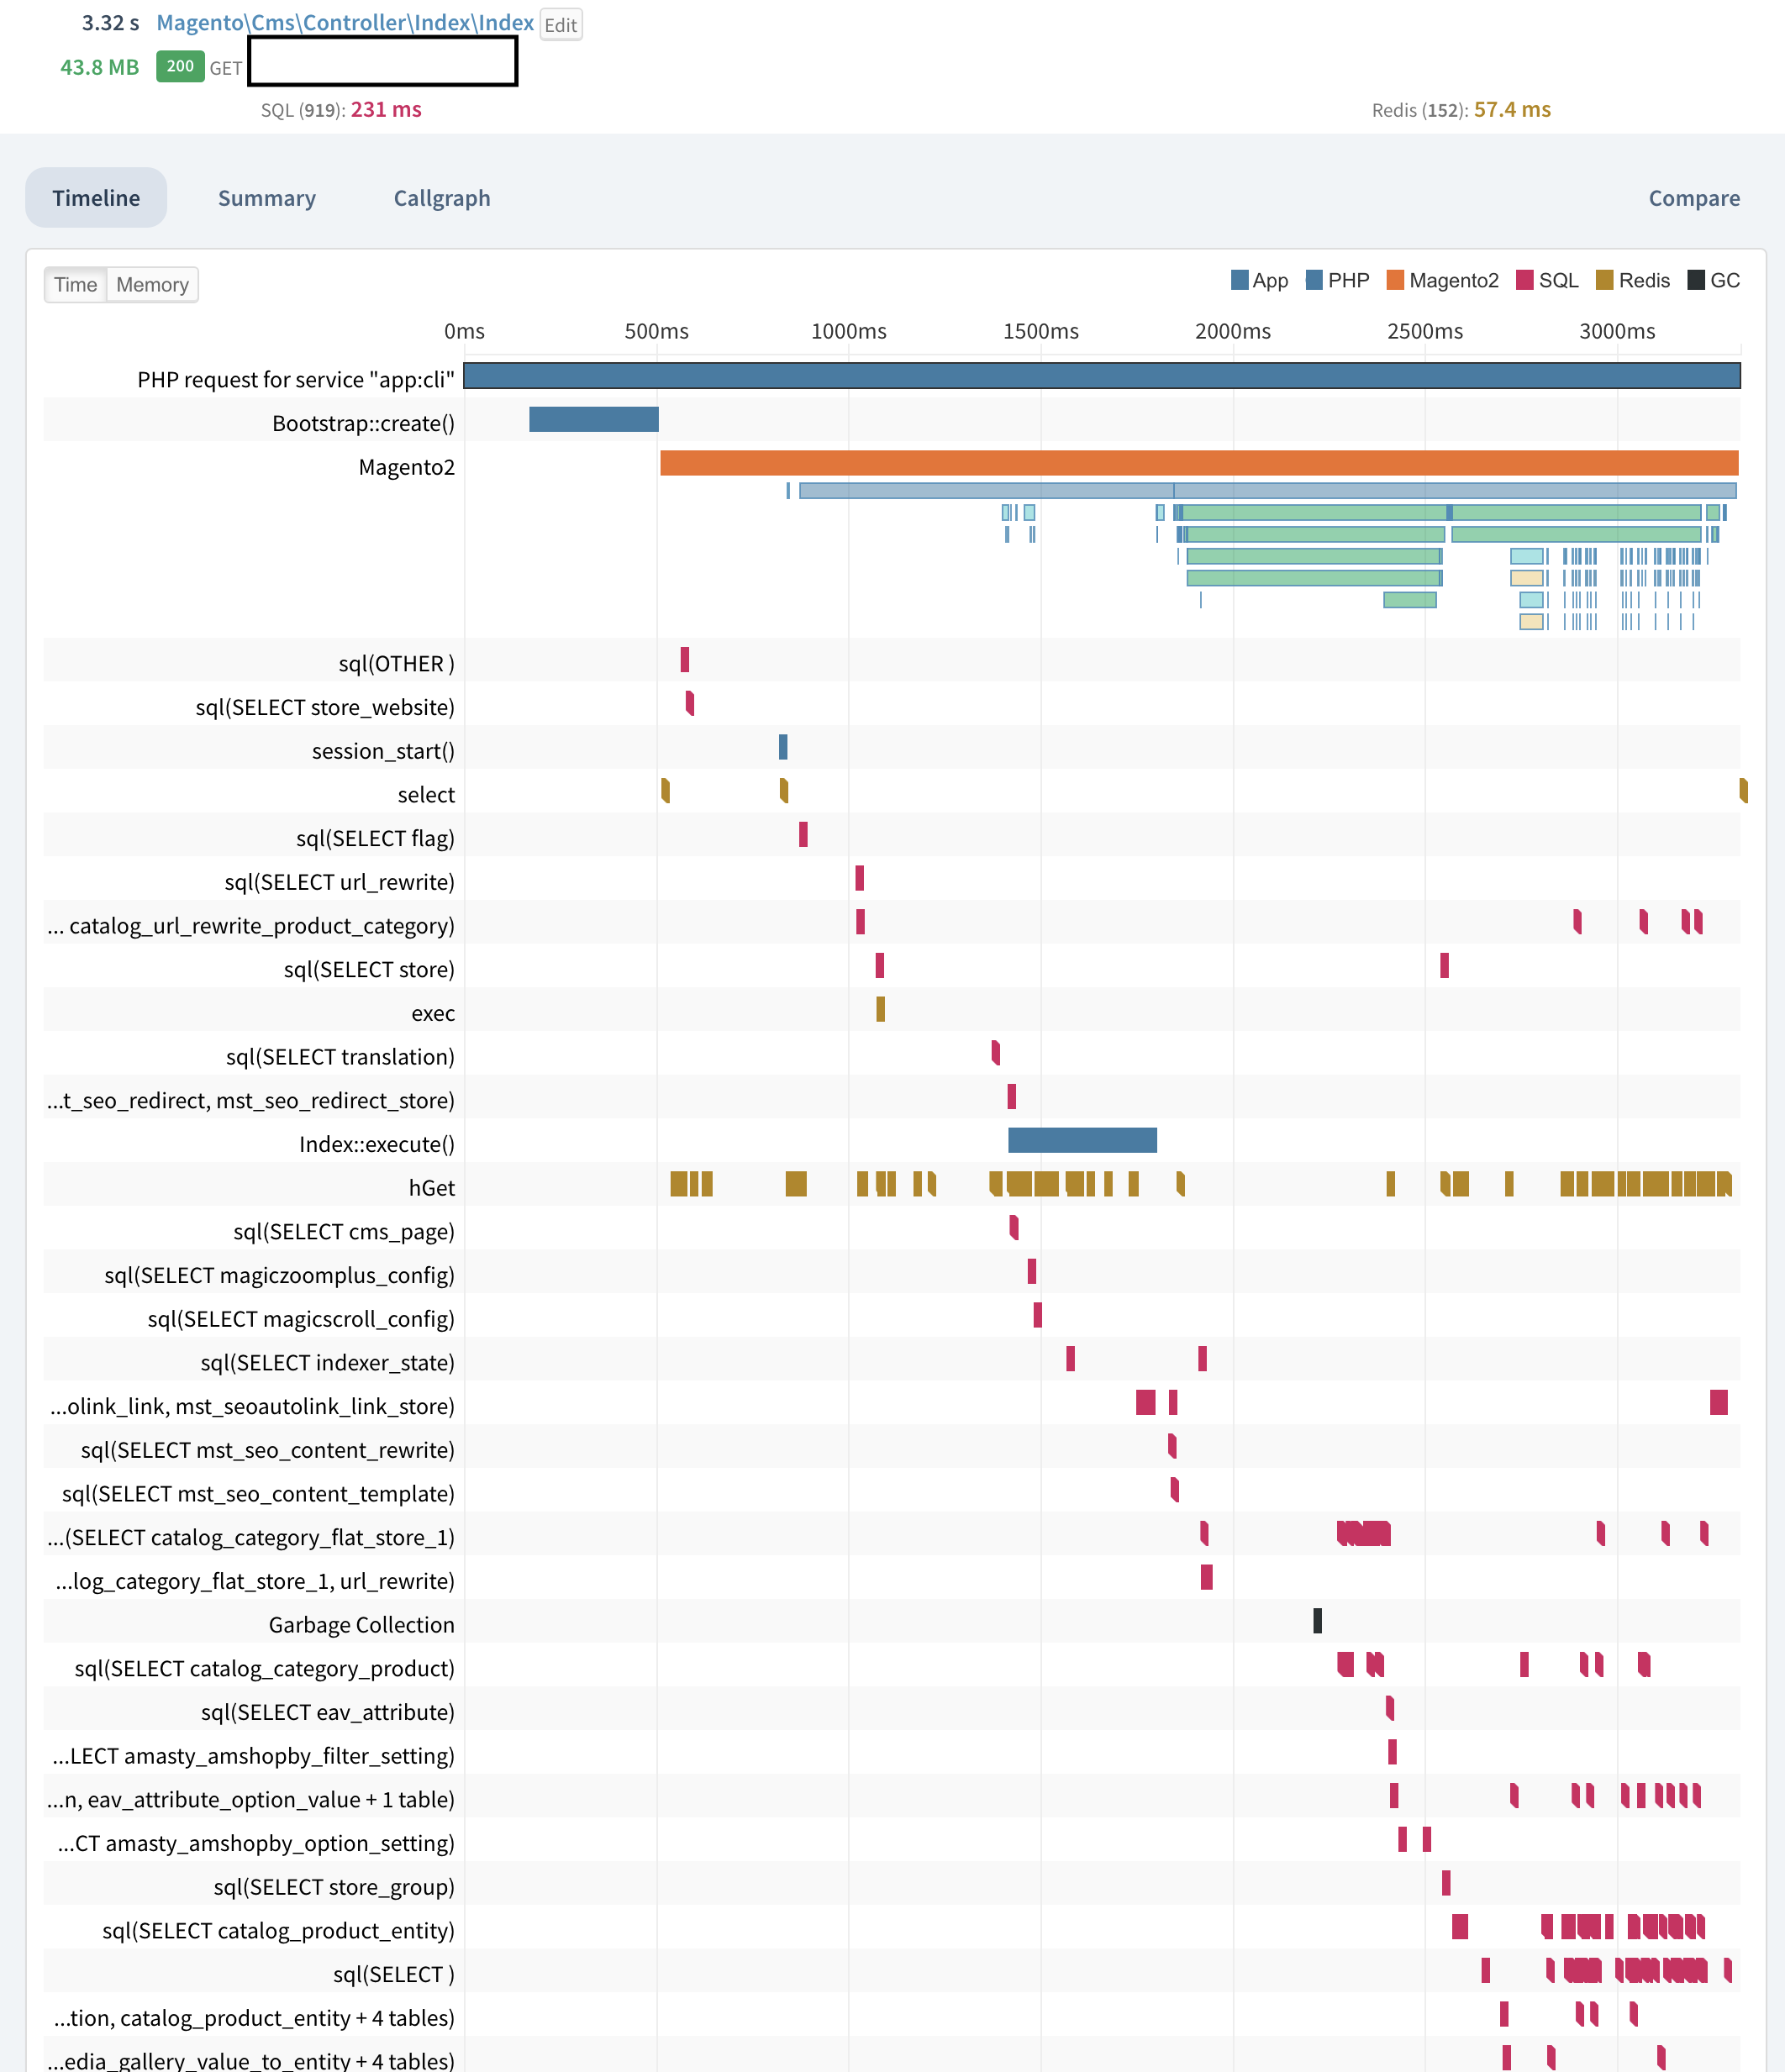
(click to enlarge)
TTFB is 3.32 seconds. Let’s see if there is any room for improvement.
Analyzing a Callgraph
Callgraph provides a waterfall diagram.
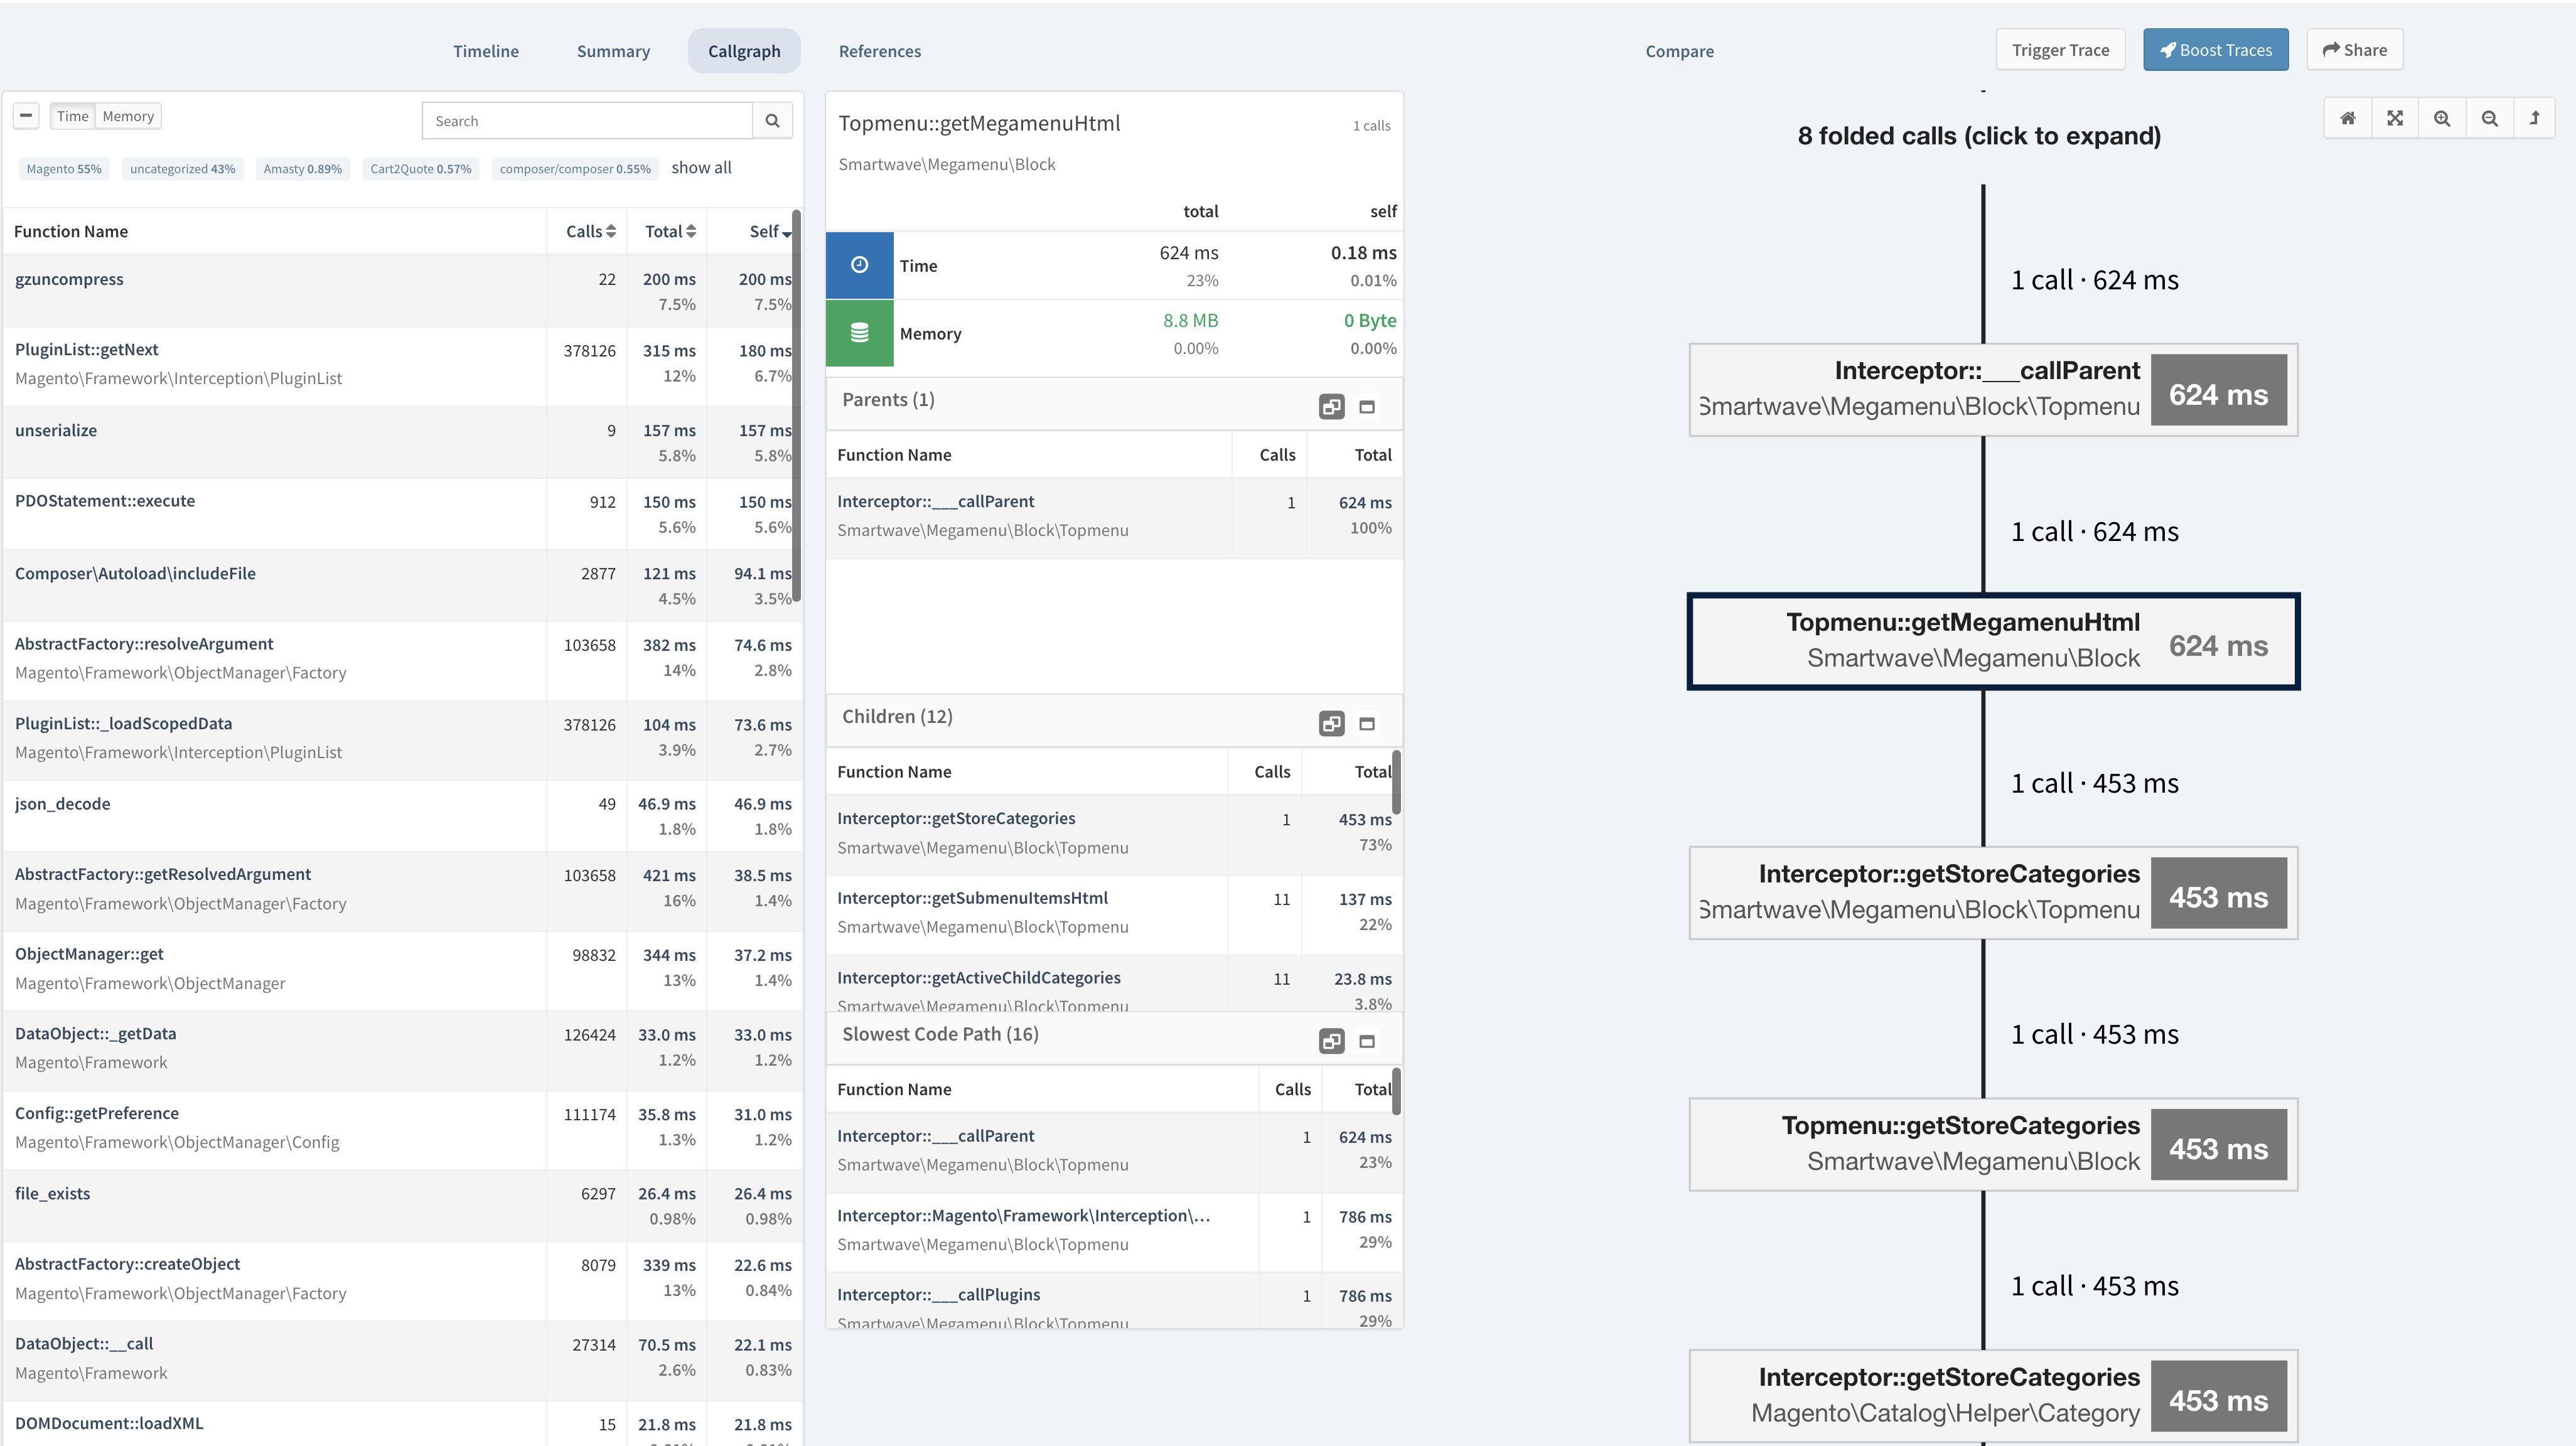
(click to enlarge)
Scroll down and analyze every function call, there should be something that contributes to that 3+ seconds TTFB.
In our case, Topmenu::getMegamemuhtml needs further investigation. This function generates top menu html and its output could be cached to save 0.6+ seconds.
Here is a screenshot of a trace with mega menu cached:
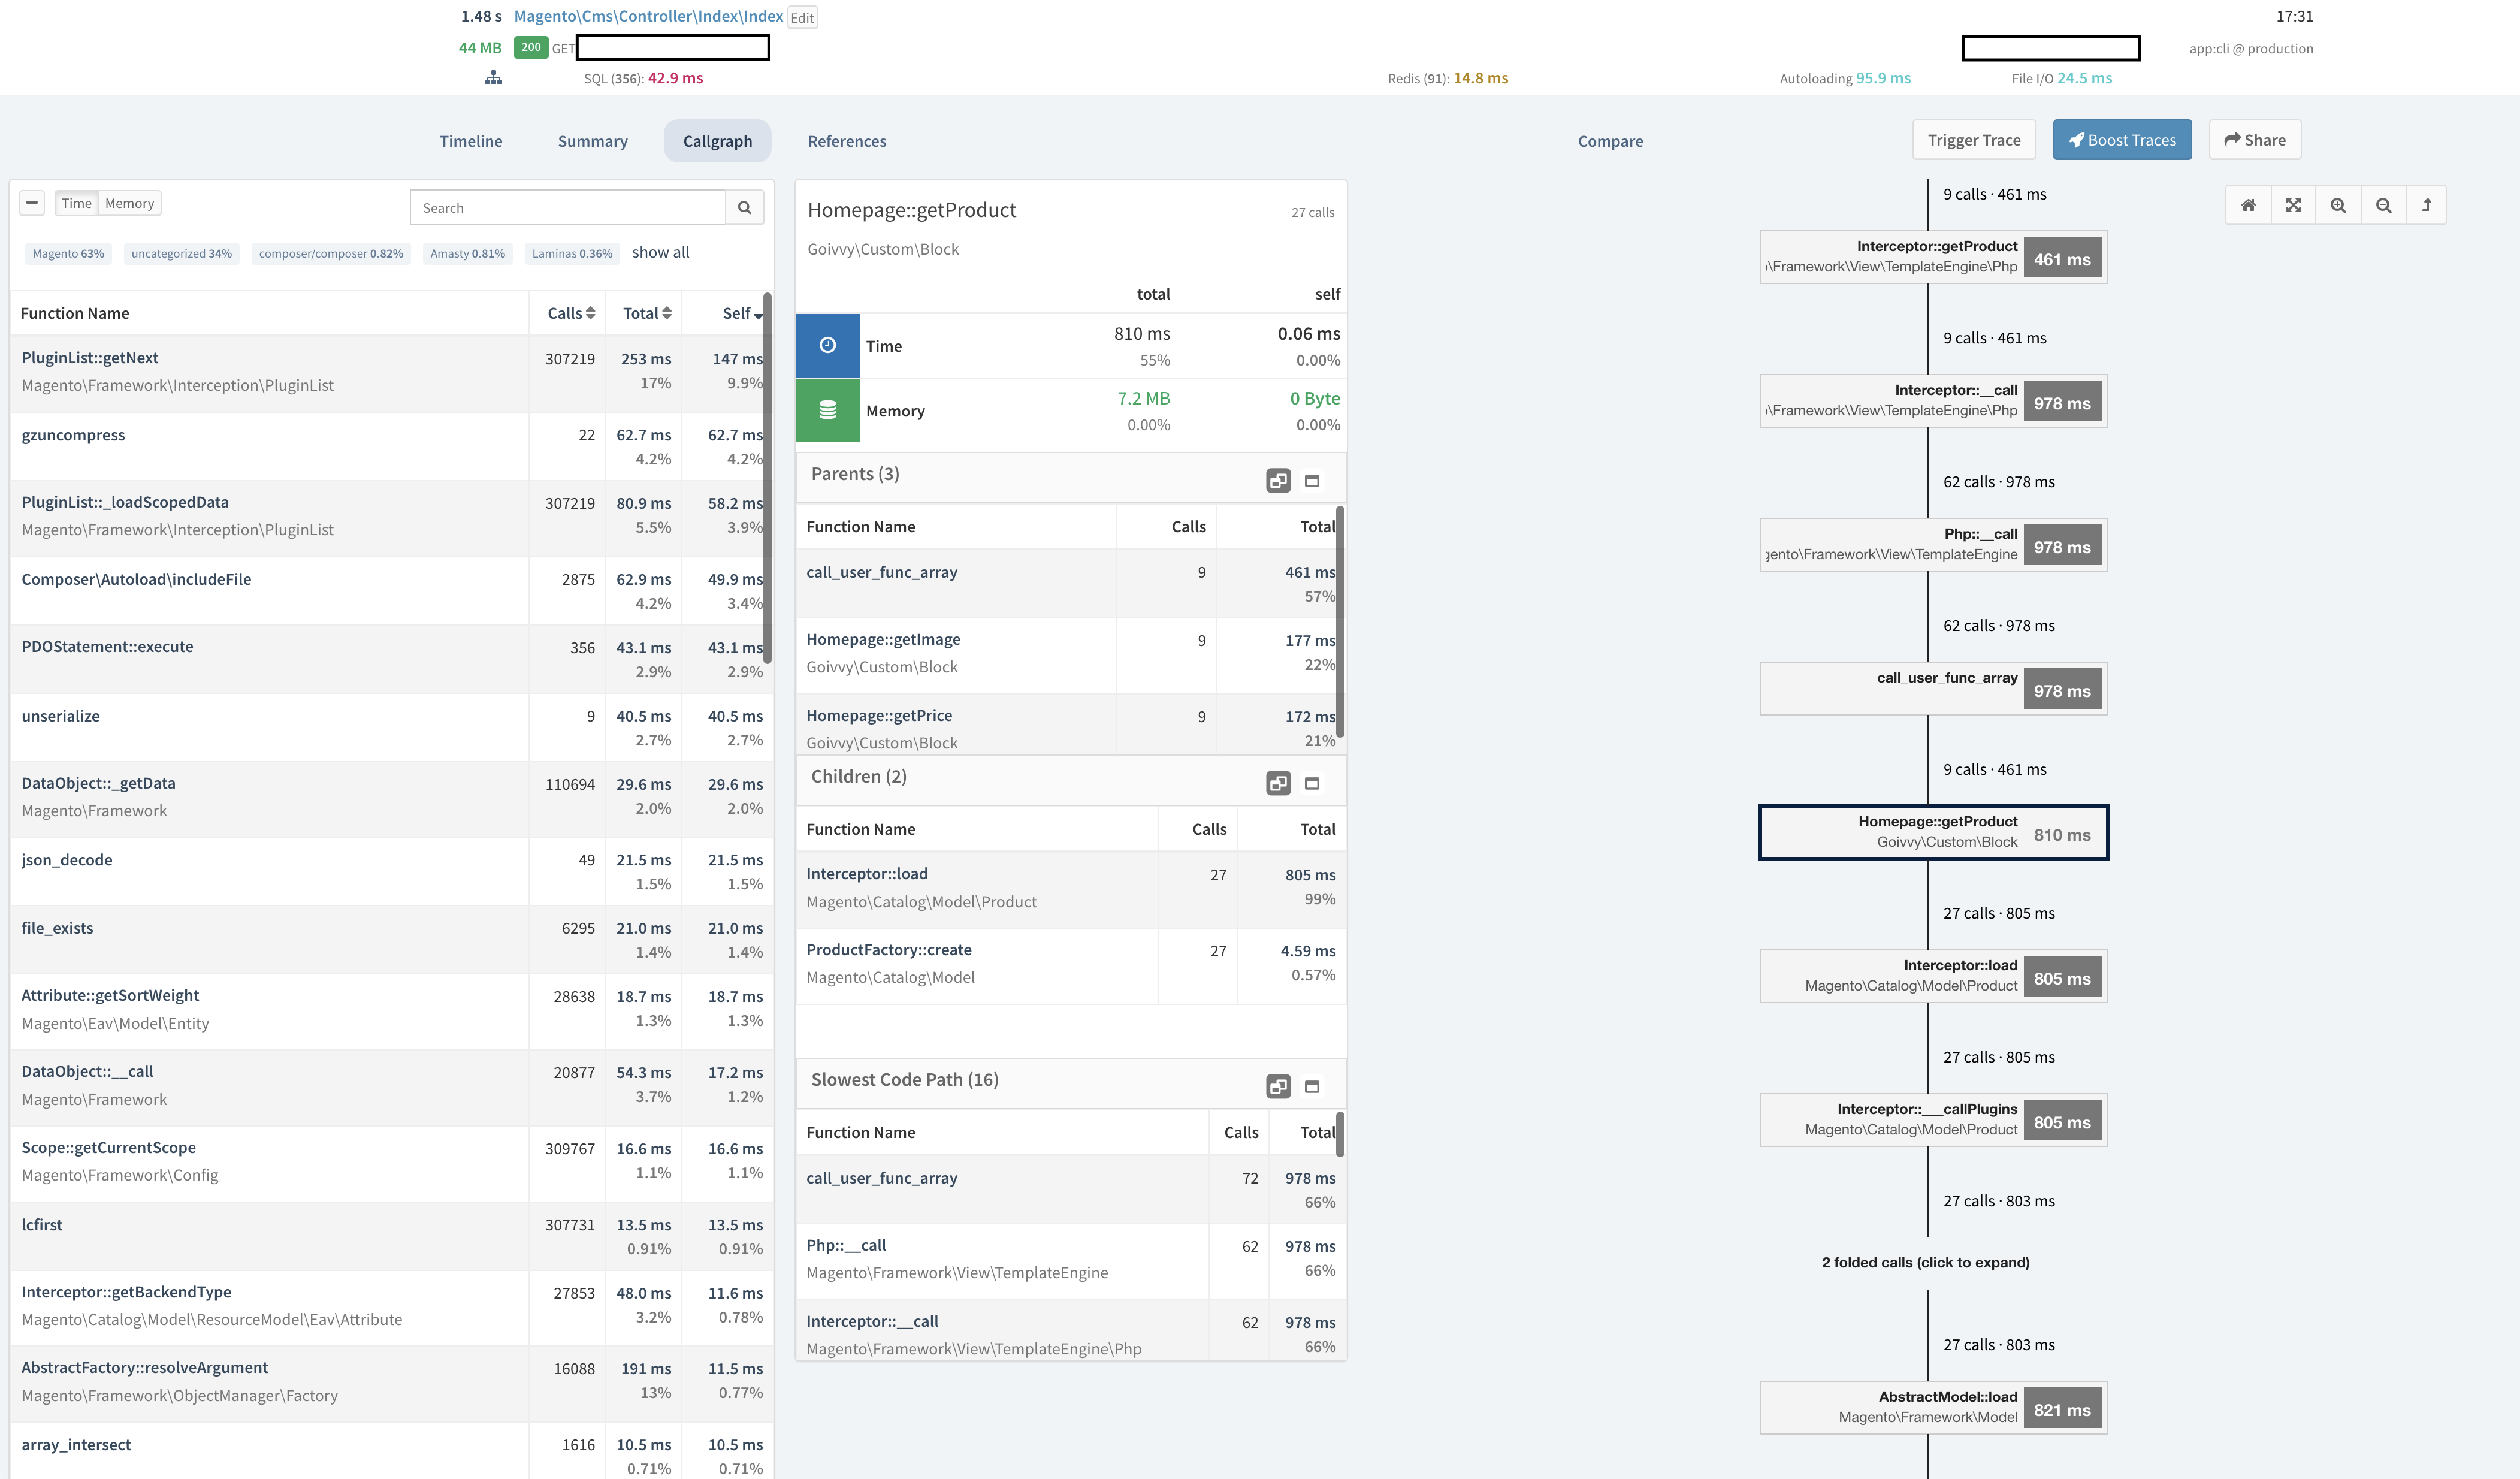
(click to enlarge)
TTFB is 1.48s now.
There is another function to improve – Homepage::getProduct, it’s selected on the screenshot above. The function takes 0.8s to be executed and it’s all because of 27 load model calls. Model loads are expensive and should be substituted with direct attribute fetching whenever possible.
There might be other slow calls, you just need to go over a tree diagram and inspect every node.
There could be slow SQL queries. You need to enable SQL profiling in General Settings:
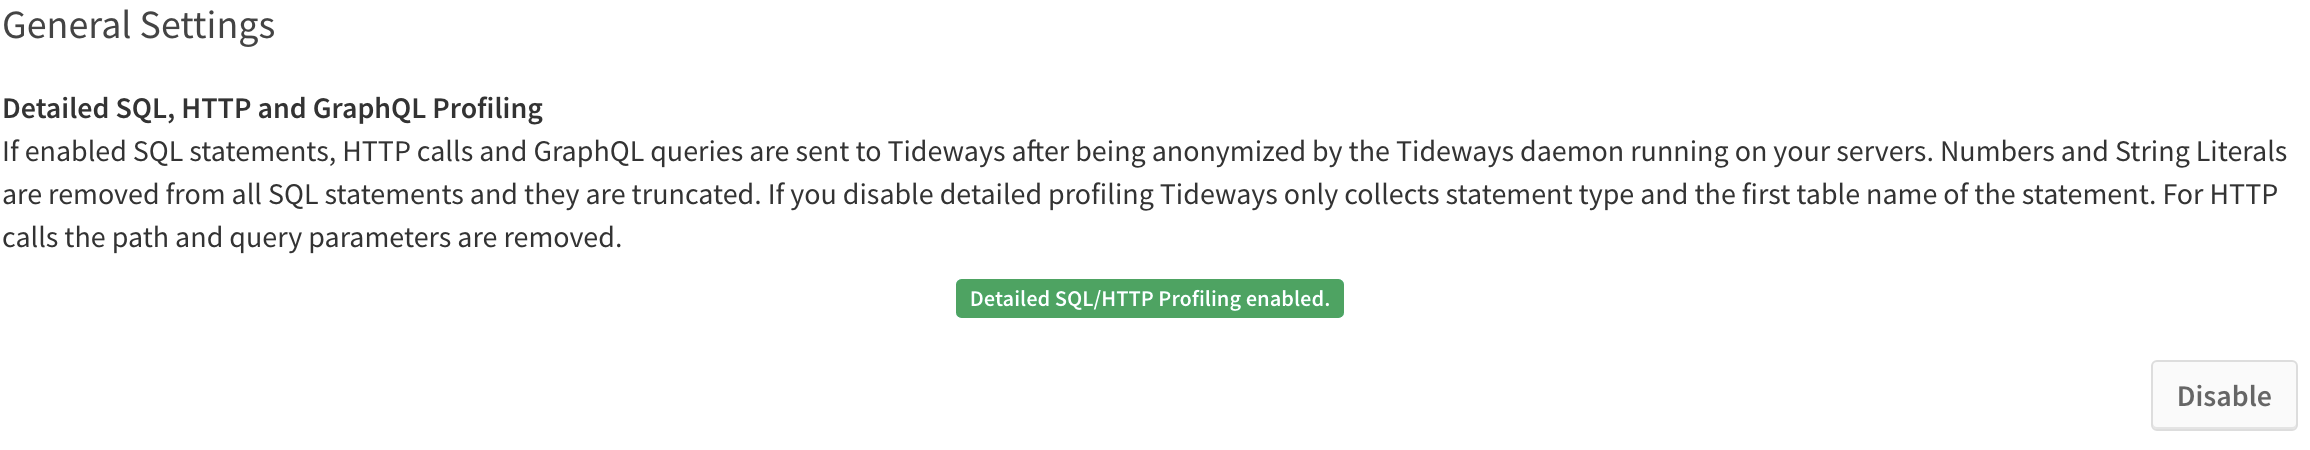
(click to enlarge)
After that any slow queries will be visible under the Bottlenecks tab.
Summary
A good code profiler can help you speed up a site and save time and money. From my experience 14 days is more than enough to figure out most performance issues.
The profiler can be used on a live (production) site, it doesn’t slow it down or cause any problems, it works with PHP 8. Let it run for a couple of hours and then inspect traces under Project > Traces.
…
About the author: Konstantin Gerasimov is a Magento certified developer with Goivvy.com. He specializes in speed optimization, migration and general Magento support.
Looking for a web host that understands ecommerce and business hosting?
Check us out today!