


2016 Black Friday & Cyber Monday Stats for the Small Online Merchant
It’s time again for our Black Friday & Cyber Monday stats report for small online stores. We’ll start by listing the stats for large merchants that have come out so far:
Big Merchants – Ecommerce Sales
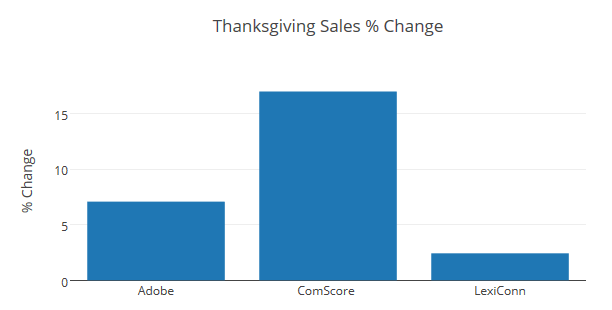
Adobe Digital Index has their numbers out for this year:
- Thanksgiving sales up 7.1% over 2015
- Black Friday sales up 21.6% over 2015
- Cyber Monday sales up 12.1% over 2015
comScore numbers for this year are:
- Thanksgiving sales up 17%
- Black Friday sales up 19%
- Cyber Monday sales up 17%
- Thanksgiving thru Cyber Monday sales up 17%
We normally pull data from Custora as well, but they have not yet released their 2016 numbers for the holiday weekend.
Adobe uses data from 5,000 companies worldwide that use the Adobe Digital Marketing Cloud for their report.
comScore doesn’t show the number of stores sourced for their data, but they mention 3,200 clients in their report.
Small Merchants – Same Stores Compared
If you’ve been following our holiday posts for the last few years, you know that one thing we do differently than most holiday stats reports is that we compare the same exact stores for both years to get true comparison results. Citing an increase in sales when your data pool has changed will obviously include changes due to the different stores or just by having a larger/smaller data pool from year to year.
In our stats we’ve used data from 167 small online stores (typically less than 10 employees) to compare the Thanksgiving holiday sales between 2015 and 2016:
- Thanksgiving sales up 2.45% over 2015
- Black Friday sales down 3.05% over 2015
- Cyber Monday sales up 0.89% over 2015
Some additional numbers, for the Thanksgiving Holiday weekend of Thursday thru Cyber Monday:
- Average order value up 3%
- Total number of orders up 0.66%
- Revenue up 2.99%
Charting The Results
 Small stores had a smaller increase on Thanksgiving than the large stores, but still improved over 2015.
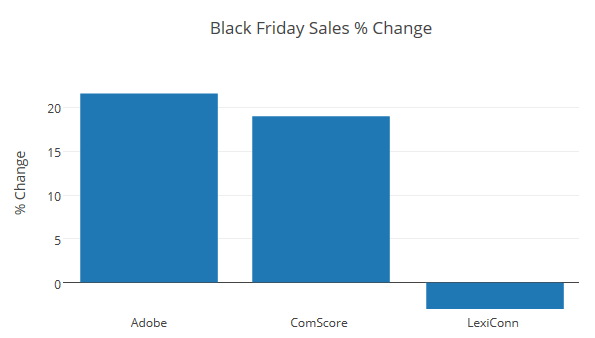
In 2015 on Black Friday our small stores out-performed the larger stores with a 31.8% increase over 2014, but this year they are down 3.05% from 2015, so they actually had a drop in sales. Why the drop? Maybe fewer of our small merchants ran sales, or it could be the big stores like Amazon eating up more of the market share. Black Friday is also primarily a day for brick & mortar stores rather than online purchases.
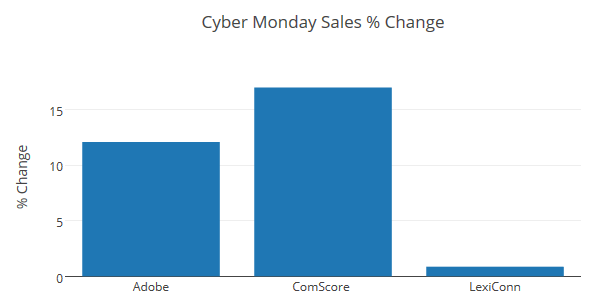 On Cyber Monday the large stores had larger increases again than the small stores, but our little guys still had an increase of just under 1% over 2015.
Even though it was a small increase over 2015, Cyber Monday was still the largest shopping day of the 5 days for the small merchants. This graph shows the percentage of sales on each day for Thursday thru Cyber Monday:
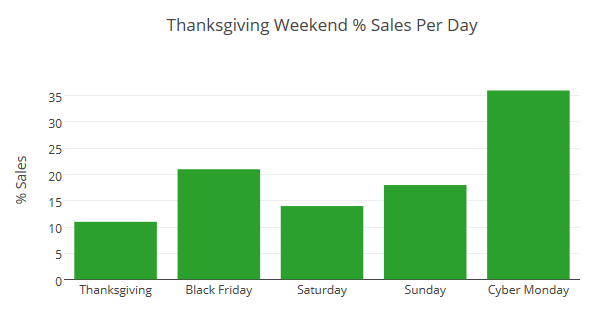 Cyber Monday had the highest with 36% of the sales (4 points higher then 2015), followed by Black Friday at 21%. The remaining 3 days all fell in the 11-18% range.
Conclusions
The small merchants again did not follow the same trends as the larger ones, which we’ve seen in our prior reports (2015, 2014, 2013, 2012), but with smaller budgets for everything, such as marketing and bulk purchasing power, they still do what they can to increase their sales each holiday season. This year they increased their total revenue by 2.99% for the 5 day weekend, again showing continued growth for the small merchant.
We’ll post another report in January covering the whole shopping season to see how our small merchants fared.
…
Graphs generated at https://plot.ly
Looking for a web host that understands ecommerce and business hosting?
Check us out today!